CORPORATE GOVERNANCE
STATEMENTS
32
CITIC ENVIROTECH LTD.
Annual Report
2015
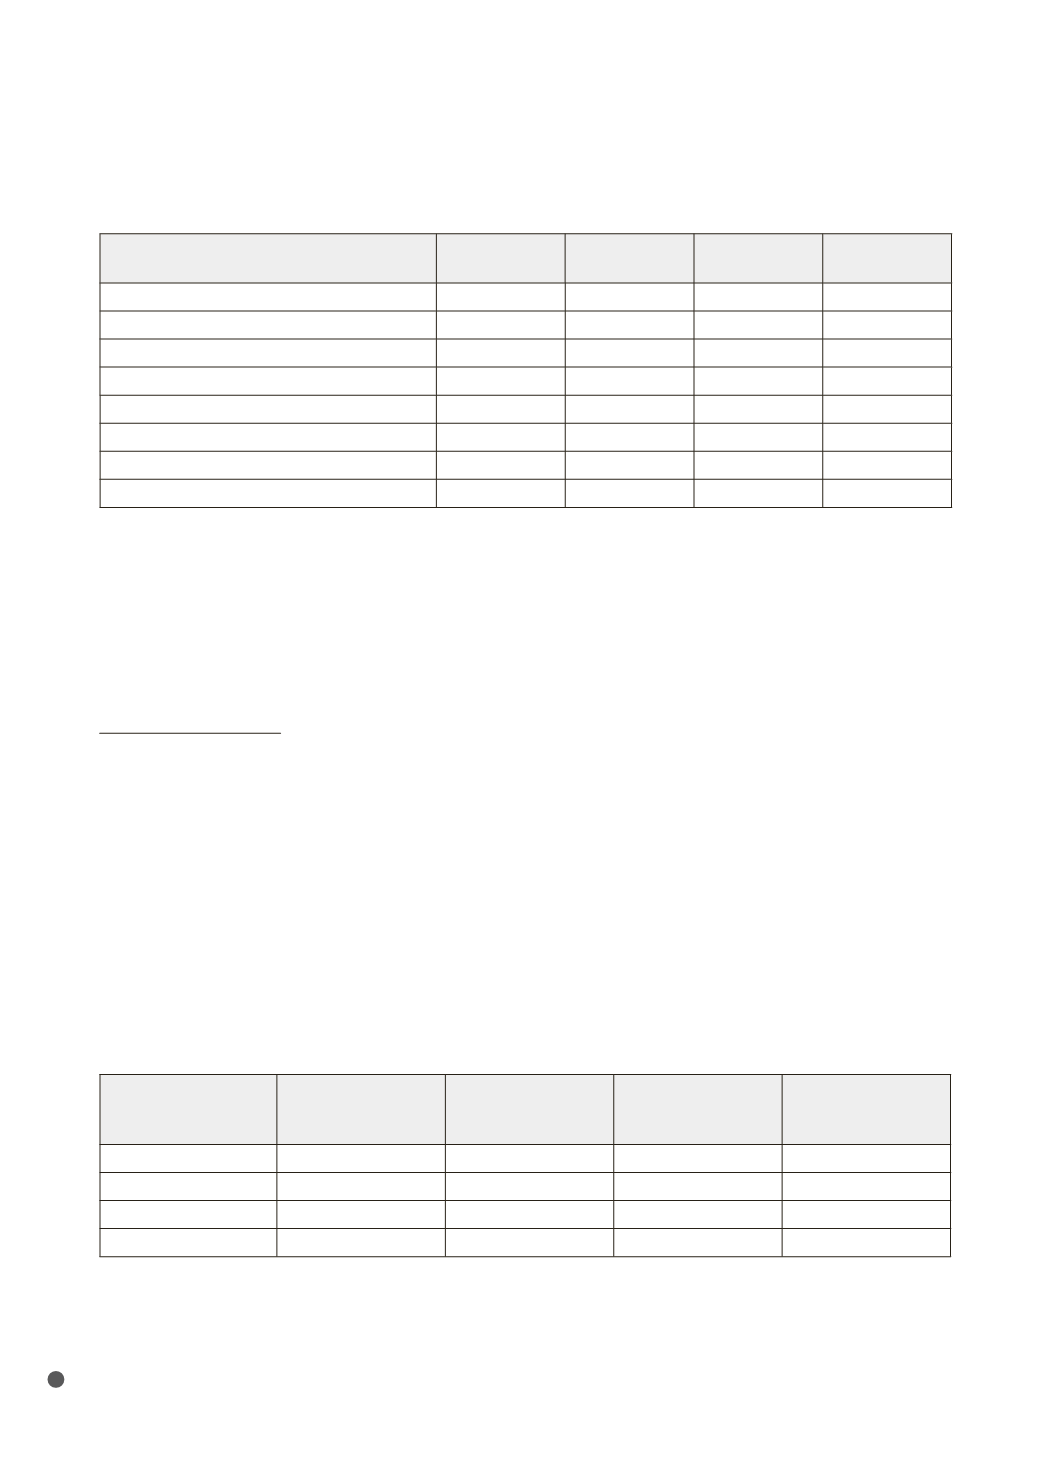
FY2012-13 FY2013-14 FY2014-15
Apr-Dec 2015
(9 Months)
Total Employee Work Hours
1,106,404
1,738,936
2,606,492
2,571,232
Total Contractor Work Hours
1,354,263
1,653,540
2,533,124
1,001,645
Cases of Occupational Illness
0
0
0
0
Cases of Employee Workplace Injuries
1
3
1
2
Cases Contractor Workplace Injuries
1
2
1
0
Number of Fatality (Employee)
0
0
0
0
Number of Fatality (Contractor)
0
0
1
0
Number of Work Days Lost (Employee)
0
183
0
4
During June 2015, in line with the China State Administration of Workplace Safety’s safety month
promotion, all operation teams in CEL implemented safety campaigns. Activities included emergency
drills, fire prevention, risk reviews, health screenings, safety quizzes and training. In response to the China
government’s call to improve chemical safety after the 12 August 2015 explosion in Tianjin, we carried out
safety practices review of project and plant sites in China, Singapore and Malaysia. As a result of the review
and feedback from operation teams, throughout October till December, we implemented standardisation
of personal protective equipment, safety signage as well as improved inventory monitoring of chemical
consumption.
Environmental Impact
Our single most important contribution to making the environment better is our core business – turning
polluted water into clean water, which is either safe for the receiving water bodies or reclaimed for suitable
applications. As at December 2015, our people operate and maintain 39 treatment plants (Note: Number
of treatment plants does not equate to number of business entities), with average volume of 1.11 million
m
3
/day (Note: Actual treated volume does not equate to volume generating income due to different
structure of concession agreements for various facilities). This is an average daily volume increase of 29%
from March 2015, when we operated 32 plants. In terms of absolute volume increase, this does not appear
to be a big number.
However, as the increase is mainly from industrial trade effluents, the wastewaters are more concentrated
(polluted) and require more effort in treatment (and therefore generate more revenue). During the period
from April to December 2015, industrial wastewater contributed to nearly 60% of our recurring income. In
the previous reporting period from April 2014 to March 2015, industrial wastewater contributed 47% of our
revenue from treatment plant operation.
Reporting Period
No. of Plants
Operated
Total Volume of
Treated Water
(Million m
3
)
Specific Energy
Consumption
(kWh/m
3
)
Revenue from
Water Treatment
(Million RMB)
April to Dec 2015
39
305
0.39
488
FY 2014 – 15
32
315
0.34
528
FY 2013 – 14
26
294
0.26
392
FY 2012 – 13
15
211
0.24
256
We are continuing our focus to increase our portfolio in industrial effluents, to leverage our strength in
innovative engineering design, application of membrane and R&D capability. Compared to municipal
wastewater, industrial trade effluents are more complex in characteristics, and vary from one trade
to another. Our design and R&D teams are able to take these problems into the laboratories and bring
effective field solutions to our clients.


